

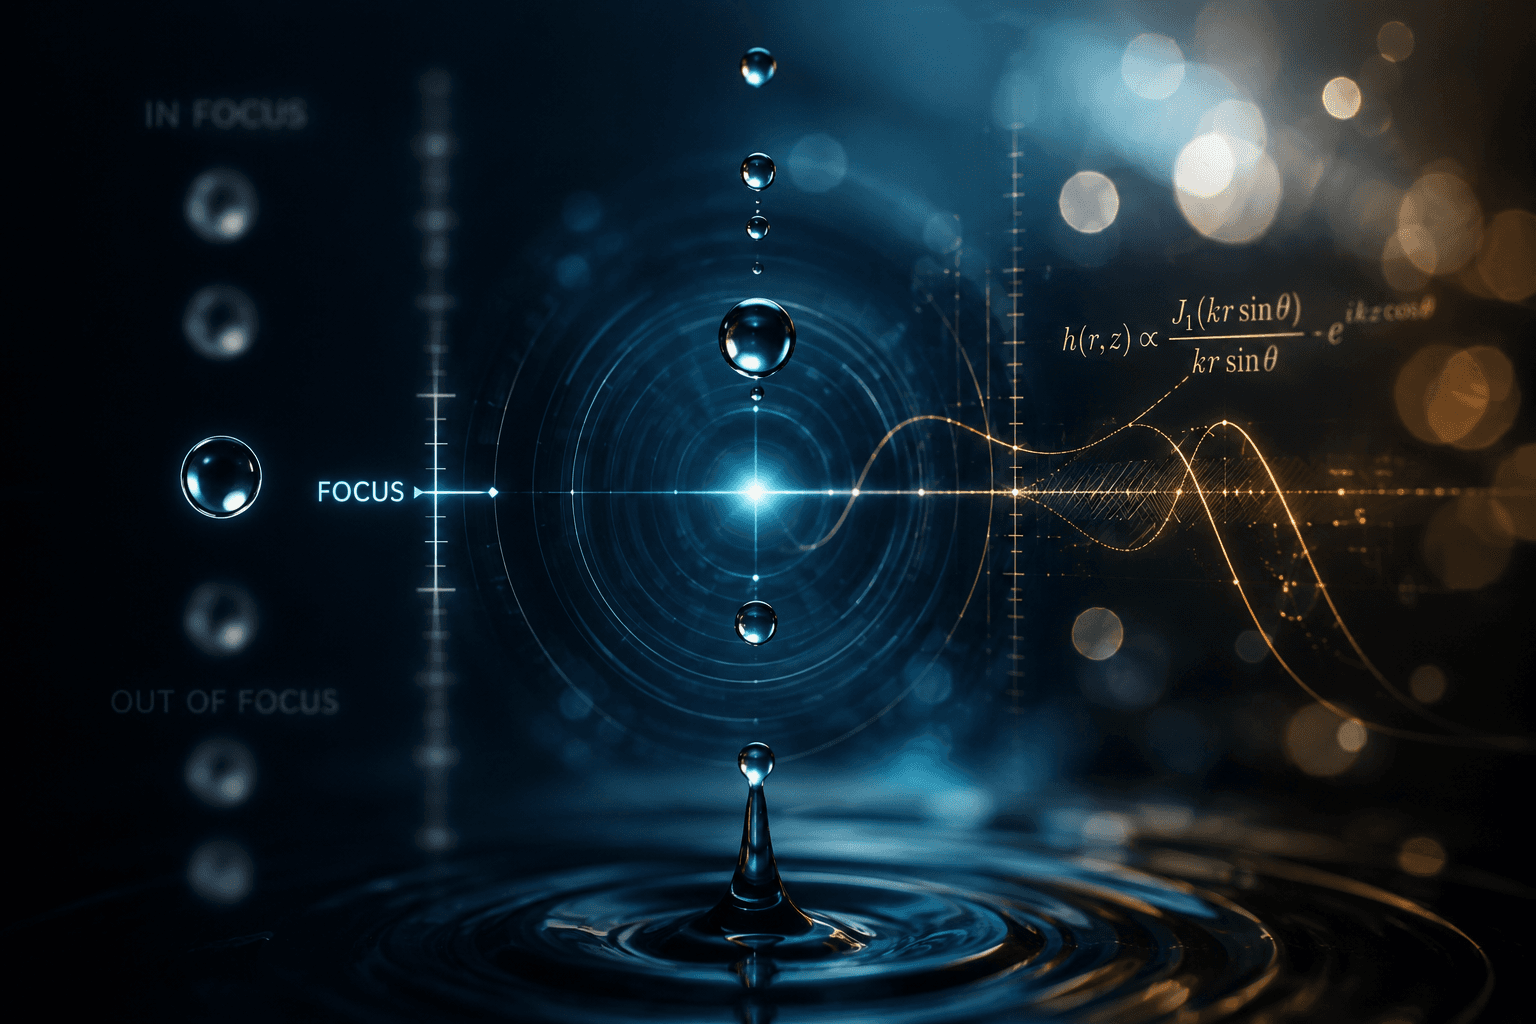
Focusing a droplet sounds like the easy part of dropwatching. Optically, it is anything but — and what happens to your measurement when the drop leaves the focal plane is worth a closer look. This article expands on a topic we recently touched on LinkedIn: what defocus blur really does to droplet metrology, which strategies exist to deal with it, and what a blur-tolerant system changes in daily practice.
Why the focal plane is smaller than you think
Every dropwatching setup — whether you observe picoliter inkjet drops or nanoliter jet-dispensed dots — lives with a fundamental optical trade-off: magnification versus depth of field. Resolving small droplets requires magnification and numerical aperture, and depth of field shrinks roughly with the square of the numerical aperture. The band in which a droplet appears truly sharp can end up thinner than the droplet itself.
Now add reality on top:
Droplets are in flight. They cross the focal plane rather than sitting in it, and jets firing at an angle drift out of focus along their own trajectory.
Satellites and ligaments — often the most interesting features diagnostically — rarely share a plane with the main drop.
In multi-nozzle printheads, not every nozzle can be at the ideal working distance at once.
Over hours of operation, thermal drift and mechanical tolerances quietly move the focus you set in the morning.
None of this is an operator error. It is geometry. The question is not whether you will measure slightly defocused drops — you will — but what that does to your numbers.
What blur actually does to a measurement
Defocus acts like a low-pass filter: the crisp edge of a droplet is smeared into a gradual intensity ramp. Classic image processing then has to decide where in that ramp the object ends — and that decision shifts as the blur grows. The detected diameter starts to depend on focus position.
For volume metrology, this is amplified by an unforgiving lever: volume scales with the cube of the diameter. A mere 1 % error in detected diameter becomes a 3 % error in volume; a couple of pixels of edge uncertainty on a ~100 µm drop can push the volume reading off by several percent. If the detected size drifts with focus, your volume trend chart shows optics, not process.

A look behind the curtain: modelling defocus
The good news is that defocus blur is not random noise — it is remarkably well-behaved physics, and that makes it modellable.
The disc PSF. In the geometric-optics picture, a defocused point source is imaged as a small uniform disc (the "circle of confusion"). Its diameter grows linearly with the defocus distance and with the numerical aperture. The blurred image is then, mathematically, the sharp scene convolved with this disc-shaped point spread function (PSF): every point of the object is replaced by a little disc, and all the discs overlap into the smooth ramp you see at the edge. This single, simple model already describes real defocused droplet images surprisingly well.
Where the Bessel functions live. Readers of our LinkedIn post may remember the warning that rigorous treatment quickly leads into Bessel functions. Here is where: diffraction. Even a perfectly focused, aberration-free lens cannot image a point as a point — the wave nature of light spreads it into the Airy pattern, whose mathematical form is built from a Bessel function of the first kind. The Airy disc is the residual blur at maximum achievable sharpness, the hard floor set by the aperture. The reassuring part for dropwatching: for realistic numerical apertures, diffraction dominates only within the last few micrometres around perfect focus. Move a few tens of micrometres out, and the geometric disc is orders of magnitude larger than the Airy pattern — the simple disc model carries the day. Monochromatic strobe illumination helps further by removing chromatic blur from the mix entirely.
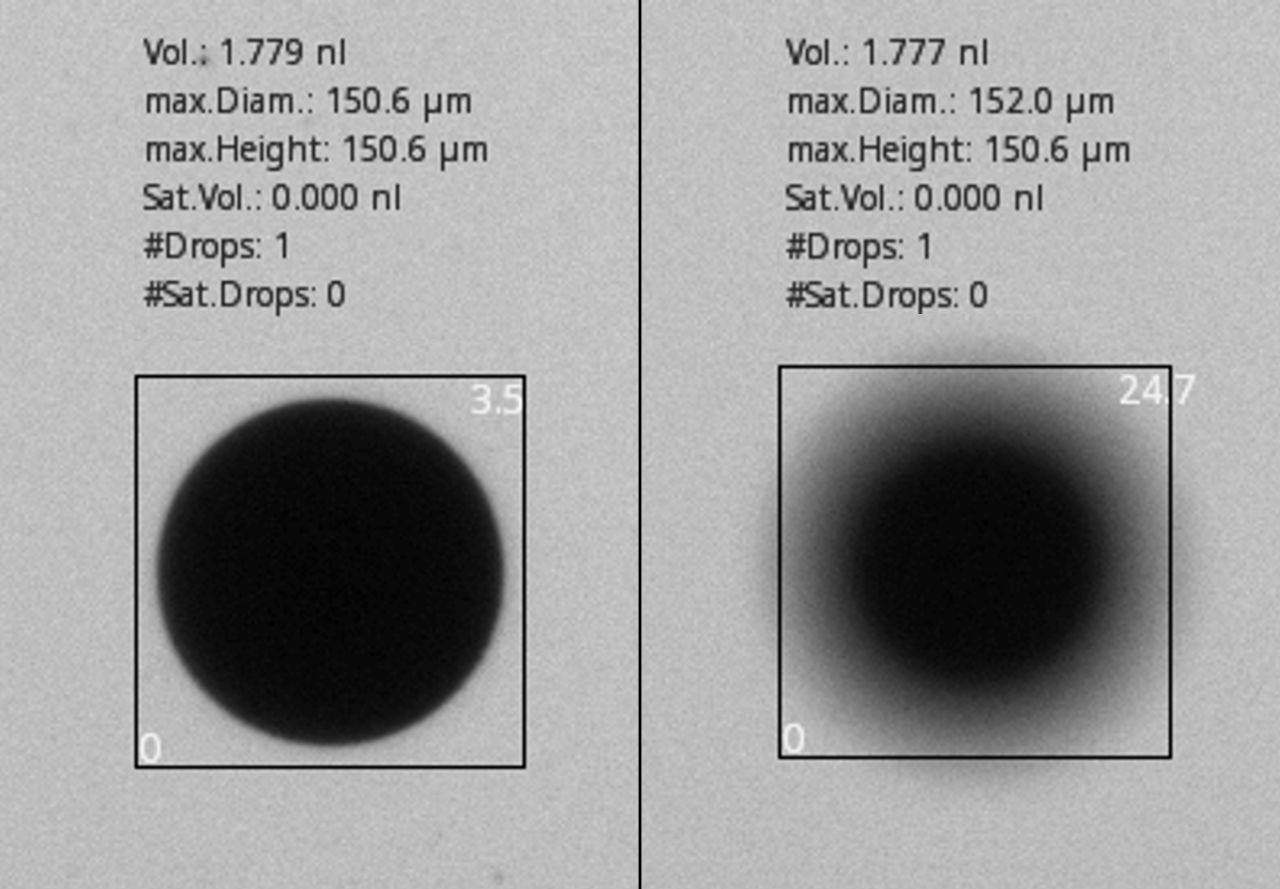
Measuring the blur. Because the edge ramp width is tied directly to the PSF size, the blur itself becomes measurable from the image — for example as an edge-width metric between defined intensity levels. A single number per image ("blur index") then tells you, and the software, how far from focus that particular drop was captured. If you have seen the small white number in the corner of our measurement images: that is exactly this idea at work.
The toolbox: how blur can be dealt with
Once the blur is understood as a convolution with a known PSF family, several strategies open up. Each has a distinct character:
Image restoration (deconvolution)
The mathematically elegant route: undo the convolution. Since convolution in image space is a multiplication in frequency space, "unsharpening" means dividing the image spectrum by the PSF spectrum. The catch is that a defocus PSF is a strong low-pass — at fine detail its spectrum approaches zero, and naïve division amplifies noise by absurd factors. Practical algorithms such as the Wiener filter add a regularisation term that caps this amplification: a tuning knob trades sharpness against noise and the characteristic ringing artefacts around edges. Deconvolution is a superb analysis and visualisation tool, but as the basis of a robust production measurement it is demanding: it needs the PSF precisely, it is computationally heavy, and its artefacts sit exactly where a metrology algorithm looks — on the edges.Model-based measurement compensation
Instead of repairing the image, one can correct the measurement: use the physical blur model to predict how a given amount of defocus shifts the detected edge or size, quantify the blur per image (see the blur index above), and compensate the derived quantity accordingly. This family keeps the processing chain lean and fast, avoids introducing artefacts into the image, and degrades gracefully — the correction simply goes to zero for sharp images.Hardware routes
Higher-end optics (telecentric lenses, higher NA with autofocus, multi-plane acquisition) push the problem away physically — at a price point that not every application can justify. For systems designed to hit the sweet spot of price and performance, software-side handling of blur is what keeps accuracy high without the exotic glass.Learning-based approaches
Neural networks can be trained to sharpen images or to estimate sizes from blurred inputs. They can work impressively — but in metrology they carry a validation burden (traceability, behaviour on out-of-distribution drops) that physics-based models sidestep.Which of these ingredients — or which combination — powers a particular product is ultimately an engineering decision balancing accuracy, speed, robustness and cost. What matters for the user is the outcome: does the number stay trustworthy when the drop is not perfectly sharp?
What this looks like in practice
For our dropwatcher portfolio, we have modelled the defocus blur and built the compensation into the measurement software. To validate it, we used a defined reference: a circular object of 150 µm nominal diameter etched into optical glass, moved through focus in steps known to 10 µm, with 1000 images acquired per position on an UltiStrobe demo stand with a 2X lens.
The result across the full tested defocus range: the relative volume deviation stays below 2 %, with a CV/RSD under 1 % — including strongly blurred images that classic edge detection would misjudge substantially. Considering the non-linear effects of real-world optics, we are quite happy with that behaviour.
Two things this explicitly does not mean: focusing does not become irrelevant — a well-set focus is still the best starting point, and extreme blur eventually costs information no algorithm can recover. And it is not magic: it is measured physics, applied consistently.
Where defocus tolerance pays off
The obvious benefit is accuracy. The less obvious benefits show up in workflows:
Angled and unstable jets. Drops that leave the focal plane along their flight path remain measurable — trajectory and volume analysis no longer end where the sharp zone ends.
Satellites and ligaments. Small features off the main focal plane can be evaluated in the same image as the main drop instead of requiring their own focus run.
Multi-nozzle arrays. When dozens of nozzles cannot all sit at the ideal working distance, a blur-tolerant measurement keeps them comparable without refocusing per nozzle.
Long-term stability. Thermal drift of optics and mechanics over a shift no longer translates directly into a volume trend — a real difference for unattended monitoring and remote operation.
Faster setup, less operator dependence. Commissioning and routine checks spend less time on the focus ritual, and results depend less on who adjusted the system.
Comparability across tools and sites. If two systems are focused slightly differently, their readings still line up — valuable for transferring processes between machines or locations.
Dispensing applications with varying stand-off. In jet dispensing of adhesives, solder pastes or conformal coatings, changing nozzle-to-camera geometries stop being a recalibration event.
Dosing validation in pharma and bioprinting. Nanoliter dosing accuracy can be verified in long statistical runs where drift would otherwise contaminate the statistics.
FAQ
Does defocus compensation replace focusing?
No. It widens the usable range around the focus dramatically and removes the drift within that range, but a reasonable initial focus remains the foundation. Severely blurred images lose real information.
Why does droplet volume react so strongly to blur?
Because volume grows with the cube of the diameter. Any systematic edge shift caused by blur is tripled (in relative terms) in the volume result — which is why edge-level care pays off so disproportionately.
Can't you simply deconvolve (sharpen) the image?
You can, and tools like the Wiener filter do it well for analysis. For robust automated metrology it is a harder sell: it requires the exact PSF, costs computation, and its ringing artefacts appear precisely at the edges a measurement relies on. Correcting the measurement with a blur model avoids those side effects.
How does the software know how blurry an image is?
From the image itself: the width of the intensity ramp at the droplet edge is a direct, calibratable measure of the blur — reported as a blur index per image.
Closing thoughts
Defocus blur in dropwatching is not an annoyance to be engineered around with ever more expensive optics — it is well-understood physics that a measurement system can model and account for. For the user, the effect is simple: numbers that stay meaningful when reality is less than perfectly sharp, and workflows that spend their time on the process instead of on the focus knob.
Want to see the behaviour on your own fluids and nozzles? Get in touch — we are happy to demonstrate the UltiStrobe and NanoStrobeX on your application.
Focusing a droplet sounds like the easy part of dropwatching. Optically, it is anything but — and what happens to your measurement when the drop leaves the focal plane is worth a closer look. This article expands on a topic we recently touched on LinkedIn: what defocus blur really does to droplet metrology, which strategies exist to deal with it, and what a blur-tolerant system changes in daily practice.
Why the focal plane is smaller than you think
Every dropwatching setup — whether you observe picoliter inkjet drops or nanoliter jet-dispensed dots — lives with a fundamental optical trade-off: magnification versus depth of field. Resolving small droplets requires magnification and numerical aperture, and depth of field shrinks roughly with the square of the numerical aperture. The band in which a droplet appears truly sharp can end up thinner than the droplet itself.
Now add reality on top:
Droplets are in flight. They cross the focal plane rather than sitting in it, and jets firing at an angle drift out of focus along their own trajectory.
Satellites and ligaments — often the most interesting features diagnostically — rarely share a plane with the main drop.
In multi-nozzle printheads, not every nozzle can be at the ideal working distance at once.
Over hours of operation, thermal drift and mechanical tolerances quietly move the focus you set in the morning.
None of this is an operator error. It is geometry. The question is not whether you will measure slightly defocused drops — you will — but what that does to your numbers.
What blur actually does to a measurement
Defocus acts like a low-pass filter: the crisp edge of a droplet is smeared into a gradual intensity ramp. Classic image processing then has to decide where in that ramp the object ends — and that decision shifts as the blur grows. The detected diameter starts to depend on focus position.
For volume metrology, this is amplified by an unforgiving lever: volume scales with the cube of the diameter. A mere 1 % error in detected diameter becomes a 3 % error in volume; a couple of pixels of edge uncertainty on a ~100 µm drop can push the volume reading off by several percent. If the detected size drifts with focus, your volume trend chart shows optics, not process.
A look behind the curtain: modelling defocus
The good news is that defocus blur is not random noise — it is remarkably well-behaved physics, and that makes it modellable.
The disc PSF. In the geometric-optics picture, a defocused point source is imaged as a small uniform disc (the "circle of confusion"). Its diameter grows linearly with the defocus distance and with the numerical aperture. The blurred image is then, mathematically, the sharp scene convolved with this disc-shaped point spread function (PSF): every point of the object is replaced by a little disc, and all the discs overlap into the smooth ramp you see at the edge. This single, simple model already describes real defocused droplet images surprisingly well.
Where the Bessel functions live. Readers of our LinkedIn post may remember the warning that rigorous treatment quickly leads into Bessel functions. Here is where: diffraction. Even a perfectly focused, aberration-free lens cannot image a point as a point — the wave nature of light spreads it into the Airy pattern, whose mathematical form is built from a Bessel function of the first kind. The Airy disc is the residual blur at maximum achievable sharpness, the hard floor set by the aperture. The reassuring part for dropwatching: for realistic numerical apertures, diffraction dominates only within the last few micrometres around perfect focus. Move a few tens of micrometres out, and the geometric disc is orders of magnitude larger than the Airy pattern — the simple disc model carries the day. Monochromatic strobe illumination helps further by removing chromatic blur from the mix entirely.
Measuring the blur. Because the edge ramp width is tied directly to the PSF size, the blur itself becomes measurable from the image — for example as an edge-width metric between defined intensity levels. A single number per image ("blur index") then tells you, and the software, how far from focus that particular drop was captured. If you have seen the small white number in the corner of our measurement images: that is exactly this idea at work.
The toolbox: how blur can be dealt with
Once the blur is understood as a convolution with a known PSF family, several strategies open up. Each has a distinct character:
Image restoration (deconvolution)
The mathematically elegant route: undo the convolution. Since convolution in image space is a multiplication in frequency space, "unsharpening" means dividing the image spectrum by the PSF spectrum. The catch is that a defocus PSF is a strong low-pass — at fine detail its spectrum approaches zero, and naïve division amplifies noise by absurd factors. Practical algorithms such as the Wiener filter add a regularisation term that caps this amplification: a tuning knob trades sharpness against noise and the characteristic ringing artefacts around edges. Deconvolution is a superb analysis and visualisation tool, but as the basis of a robust production measurement it is demanding: it needs the PSF precisely, it is computationally heavy, and its artefacts sit exactly where a metrology algorithm looks — on the edges.Model-based measurement compensation
Instead of repairing the image, one can correct the measurement: use the physical blur model to predict how a given amount of defocus shifts the detected edge or size, quantify the blur per image (see the blur index above), and compensate the derived quantity accordingly. This family keeps the processing chain lean and fast, avoids introducing artefacts into the image, and degrades gracefully — the correction simply goes to zero for sharp images.Hardware routes
Higher-end optics (telecentric lenses, higher NA with autofocus, multi-plane acquisition) push the problem away physically — at a price point that not every application can justify. For systems designed to hit the sweet spot of price and performance, software-side handling of blur is what keeps accuracy high without the exotic glass.Learning-based approaches
Neural networks can be trained to sharpen images or to estimate sizes from blurred inputs. They can work impressively — but in metrology they carry a validation burden (traceability, behaviour on out-of-distribution drops) that physics-based models sidestep.Which of these ingredients — or which combination — powers a particular product is ultimately an engineering decision balancing accuracy, speed, robustness and cost. What matters for the user is the outcome: does the number stay trustworthy when the drop is not perfectly sharp?
What this looks like in practice
For our dropwatcher portfolio, we have modelled the defocus blur and built the compensation into the measurement software. To validate it, we used a defined reference: a circular object of 150 µm nominal diameter etched into optical glass, moved through focus in steps known to 10 µm, with 1000 images acquired per position on an UltiStrobe demo stand with a 2X lens.
The result across the full tested defocus range: the relative volume deviation stays below 2 %, with a CV/RSD under 1 % — including strongly blurred images that classic edge detection would misjudge substantially. Considering the non-linear effects of real-world optics, we are quite happy with that behaviour.
Two things this explicitly does not mean: focusing does not become irrelevant — a well-set focus is still the best starting point, and extreme blur eventually costs information no algorithm can recover. And it is not magic: it is measured physics, applied consistently.
Where defocus tolerance pays off
The obvious benefit is accuracy. The less obvious benefits show up in workflows:
Angled and unstable jets. Drops that leave the focal plane along their flight path remain measurable — trajectory and volume analysis no longer end where the sharp zone ends.
Satellites and ligaments. Small features off the main focal plane can be evaluated in the same image as the main drop instead of requiring their own focus run.
Multi-nozzle arrays. When dozens of nozzles cannot all sit at the ideal working distance, a blur-tolerant measurement keeps them comparable without refocusing per nozzle.
Long-term stability. Thermal drift of optics and mechanics over a shift no longer translates directly into a volume trend — a real difference for unattended monitoring and remote operation.
Faster setup, less operator dependence. Commissioning and routine checks spend less time on the focus ritual, and results depend less on who adjusted the system.
Comparability across tools and sites. If two systems are focused slightly differently, their readings still line up — valuable for transferring processes between machines or locations.
Dispensing applications with varying stand-off. In jet dispensing of adhesives, solder pastes or conformal coatings, changing nozzle-to-camera geometries stop being a recalibration event.
Dosing validation in pharma and bioprinting. Nanoliter dosing accuracy can be verified in long statistical runs where drift would otherwise contaminate the statistics.
FAQ
Does defocus compensation replace focusing?
No. It widens the usable range around the focus dramatically and removes the drift within that range, but a reasonable initial focus remains the foundation. Severely blurred images lose real information.
Why does droplet volume react so strongly to blur?
Because volume grows with the cube of the diameter. Any systematic edge shift caused by blur is tripled (in relative terms) in the volume result — which is why edge-level care pays off so disproportionately.
Can't you simply deconvolve (sharpen) the image?
You can, and tools like the Wiener filter do it well for analysis. For robust automated metrology it is a harder sell: it requires the exact PSF, costs computation, and its ringing artefacts appear precisely at the edges a measurement relies on. Correcting the measurement with a blur model avoids those side effects.
How does the software know how blurry an image is?
From the image itself: the width of the intensity ramp at the droplet edge is a direct, calibratable measure of the blur — reported as a blur index per image.
Closing thoughts
Defocus blur in dropwatching is not an annoyance to be engineered around with ever more expensive optics — it is well-understood physics that a measurement system can model and account for. For the user, the effect is simple: numbers that stay meaningful when reality is less than perfectly sharp, and workflows that spend their time on the process instead of on the focus knob.
Want to see the behaviour on your own fluids and nozzles? Get in touch — we are happy to demonstrate the UltiStrobe and NanoStrobeX on your application.
Focusing a droplet sounds like the easy part of dropwatching. Optically, it is anything but — and what happens to your measurement when the drop leaves the focal plane is worth a closer look. This article expands on a topic we recently touched on LinkedIn: what defocus blur really does to droplet metrology, which strategies exist to deal with it, and what a blur-tolerant system changes in daily practice.
Why the focal plane is smaller than you think
Every dropwatching setup — whether you observe picoliter inkjet drops or nanoliter jet-dispensed dots — lives with a fundamental optical trade-off: magnification versus depth of field. Resolving small droplets requires magnification and numerical aperture, and depth of field shrinks roughly with the square of the numerical aperture. The band in which a droplet appears truly sharp can end up thinner than the droplet itself.
Now add reality on top:
Droplets are in flight. They cross the focal plane rather than sitting in it, and jets firing at an angle drift out of focus along their own trajectory.
Satellites and ligaments — often the most interesting features diagnostically — rarely share a plane with the main drop.
In multi-nozzle printheads, not every nozzle can be at the ideal working distance at once.
Over hours of operation, thermal drift and mechanical tolerances quietly move the focus you set in the morning.
None of this is an operator error. It is geometry. The question is not whether you will measure slightly defocused drops — you will — but what that does to your numbers.
What blur actually does to a measurement
Defocus acts like a low-pass filter: the crisp edge of a droplet is smeared into a gradual intensity ramp. Classic image processing then has to decide where in that ramp the object ends — and that decision shifts as the blur grows. The detected diameter starts to depend on focus position.
For volume metrology, this is amplified by an unforgiving lever: volume scales with the cube of the diameter. A mere 1 % error in detected diameter becomes a 3 % error in volume; a couple of pixels of edge uncertainty on a ~100 µm drop can push the volume reading off by several percent. If the detected size drifts with focus, your volume trend chart shows optics, not process.
A look behind the curtain: modelling defocus
The good news is that defocus blur is not random noise — it is remarkably well-behaved physics, and that makes it modellable.
The disc PSF. In the geometric-optics picture, a defocused point source is imaged as a small uniform disc (the "circle of confusion"). Its diameter grows linearly with the defocus distance and with the numerical aperture. The blurred image is then, mathematically, the sharp scene convolved with this disc-shaped point spread function (PSF): every point of the object is replaced by a little disc, and all the discs overlap into the smooth ramp you see at the edge. This single, simple model already describes real defocused droplet images surprisingly well.
Where the Bessel functions live. Readers of our LinkedIn post may remember the warning that rigorous treatment quickly leads into Bessel functions. Here is where: diffraction. Even a perfectly focused, aberration-free lens cannot image a point as a point — the wave nature of light spreads it into the Airy pattern, whose mathematical form is built from a Bessel function of the first kind. The Airy disc is the residual blur at maximum achievable sharpness, the hard floor set by the aperture. The reassuring part for dropwatching: for realistic numerical apertures, diffraction dominates only within the last few micrometres around perfect focus. Move a few tens of micrometres out, and the geometric disc is orders of magnitude larger than the Airy pattern — the simple disc model carries the day. Monochromatic strobe illumination helps further by removing chromatic blur from the mix entirely.
Measuring the blur. Because the edge ramp width is tied directly to the PSF size, the blur itself becomes measurable from the image — for example as an edge-width metric between defined intensity levels. A single number per image ("blur index") then tells you, and the software, how far from focus that particular drop was captured. If you have seen the small white number in the corner of our measurement images: that is exactly this idea at work.
The toolbox: how blur can be dealt with
Once the blur is understood as a convolution with a known PSF family, several strategies open up. Each has a distinct character:
Image restoration (deconvolution)
The mathematically elegant route: undo the convolution. Since convolution in image space is a multiplication in frequency space, "unsharpening" means dividing the image spectrum by the PSF spectrum. The catch is that a defocus PSF is a strong low-pass — at fine detail its spectrum approaches zero, and naïve division amplifies noise by absurd factors. Practical algorithms such as the Wiener filter add a regularisation term that caps this amplification: a tuning knob trades sharpness against noise and the characteristic ringing artefacts around edges. Deconvolution is a superb analysis and visualisation tool, but as the basis of a robust production measurement it is demanding: it needs the PSF precisely, it is computationally heavy, and its artefacts sit exactly where a metrology algorithm looks — on the edges.Model-based measurement compensation
Instead of repairing the image, one can correct the measurement: use the physical blur model to predict how a given amount of defocus shifts the detected edge or size, quantify the blur per image (see the blur index above), and compensate the derived quantity accordingly. This family keeps the processing chain lean and fast, avoids introducing artefacts into the image, and degrades gracefully — the correction simply goes to zero for sharp images.Hardware routes
Higher-end optics (telecentric lenses, higher NA with autofocus, multi-plane acquisition) push the problem away physically — at a price point that not every application can justify. For systems designed to hit the sweet spot of price and performance, software-side handling of blur is what keeps accuracy high without the exotic glass.Learning-based approaches
Neural networks can be trained to sharpen images or to estimate sizes from blurred inputs. They can work impressively — but in metrology they carry a validation burden (traceability, behaviour on out-of-distribution drops) that physics-based models sidestep.Which of these ingredients — or which combination — powers a particular product is ultimately an engineering decision balancing accuracy, speed, robustness and cost. What matters for the user is the outcome: does the number stay trustworthy when the drop is not perfectly sharp?
What this looks like in practice
For our dropwatcher portfolio, we have modelled the defocus blur and built the compensation into the measurement software. To validate it, we used a defined reference: a circular object of 150 µm nominal diameter etched into optical glass, moved through focus in steps known to 10 µm, with 1000 images acquired per position on an UltiStrobe demo stand with a 2X lens.
The result across the full tested defocus range: the relative volume deviation stays below 2 %, with a CV/RSD under 1 % — including strongly blurred images that classic edge detection would misjudge substantially. Considering the non-linear effects of real-world optics, we are quite happy with that behaviour.
Two things this explicitly does not mean: focusing does not become irrelevant — a well-set focus is still the best starting point, and extreme blur eventually costs information no algorithm can recover. And it is not magic: it is measured physics, applied consistently.
Where defocus tolerance pays off
The obvious benefit is accuracy. The less obvious benefits show up in workflows:
Angled and unstable jets. Drops that leave the focal plane along their flight path remain measurable — trajectory and volume analysis no longer end where the sharp zone ends.
Satellites and ligaments. Small features off the main focal plane can be evaluated in the same image as the main drop instead of requiring their own focus run.
Multi-nozzle arrays. When dozens of nozzles cannot all sit at the ideal working distance, a blur-tolerant measurement keeps them comparable without refocusing per nozzle.
Long-term stability. Thermal drift of optics and mechanics over a shift no longer translates directly into a volume trend — a real difference for unattended monitoring and remote operation.
Faster setup, less operator dependence. Commissioning and routine checks spend less time on the focus ritual, and results depend less on who adjusted the system.
Comparability across tools and sites. If two systems are focused slightly differently, their readings still line up — valuable for transferring processes between machines or locations.
Dispensing applications with varying stand-off. In jet dispensing of adhesives, solder pastes or conformal coatings, changing nozzle-to-camera geometries stop being a recalibration event.
Dosing validation in pharma and bioprinting. Nanoliter dosing accuracy can be verified in long statistical runs where drift would otherwise contaminate the statistics.
FAQ
Does defocus compensation replace focusing?
No. It widens the usable range around the focus dramatically and removes the drift within that range, but a reasonable initial focus remains the foundation. Severely blurred images lose real information.
Why does droplet volume react so strongly to blur?
Because volume grows with the cube of the diameter. Any systematic edge shift caused by blur is tripled (in relative terms) in the volume result — which is why edge-level care pays off so disproportionately.
Can't you simply deconvolve (sharpen) the image?
You can, and tools like the Wiener filter do it well for analysis. For robust automated metrology it is a harder sell: it requires the exact PSF, costs computation, and its ringing artefacts appear precisely at the edges a measurement relies on. Correcting the measurement with a blur model avoids those side effects.
How does the software know how blurry an image is?
From the image itself: the width of the intensity ramp at the droplet edge is a direct, calibratable measure of the blur — reported as a blur index per image.
Closing thoughts
Defocus blur in dropwatching is not an annoyance to be engineered around with ever more expensive optics — it is well-understood physics that a measurement system can model and account for. For the user, the effect is simple: numbers that stay meaningful when reality is less than perfectly sharp, and workflows that spend their time on the process instead of on the focus knob.
Want to see the behaviour on your own fluids and nozzles? Get in touch — we are happy to demonstrate the UltiStrobe and NanoStrobeX on your application.